ASK
We are tasked with analyzing smart device usage to gain insight into how customers are using their smart devices. Questions to guide our analysis:
Business Task: Helping Bellabeat determine what customers use their smart devices for the most and how they can leverage it via their social media
Stakeholders: The executive team and the marketing analytics team
PREPARE
Notes about data integrity
-Looks like some of the answers are in long format in excel
-No need to licensing or security as it’s from kaggle which is open source
-There is definitely sampling bias as there were only 30 people surveyed
-There could also be an interpretation and/or confirmation bias as these were taken from mid-April to mid-May, which normally would not be representative of activities done, say, -during the winter months.
The data should allow us to plot effective graphs and charts to show correlation for things such as:
PROCESS
Clean up data in excel by either removing the null values or converting to them integers (value of 0) so that data was consistent
Filter data using R
-Cleaned up ID by combining data sets to better view data
All documentation is on Github
SHARE
All graphs/charts were done in R, coding can be found in the
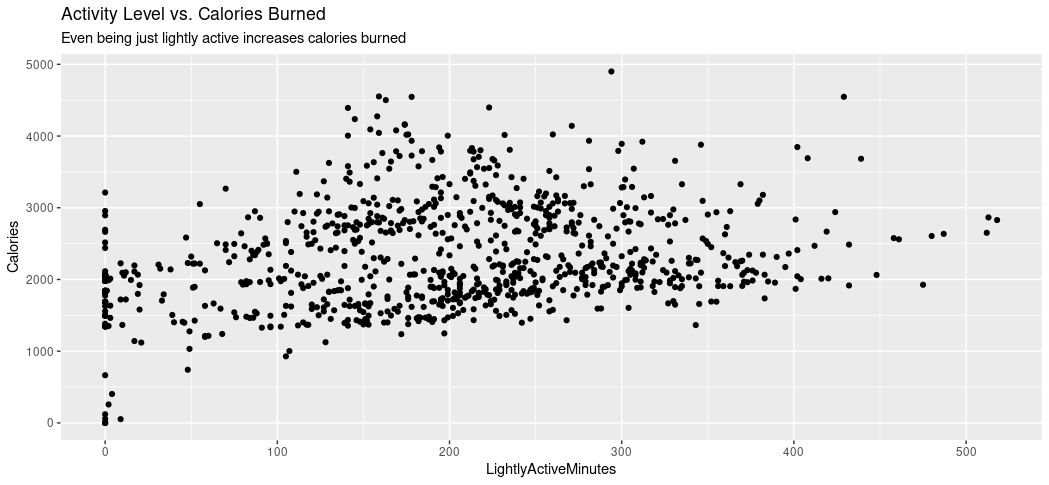
This graph charts the relationship between light activity levels and calories burned. According to fitbit, it defines lightly active as being between 1000-10,000 daily steps. In my analysis, it was shown that the average number of steps taken between all users was just over 7,500 hence the usage of lightly active minutes as opposed to, say, very active minutes.
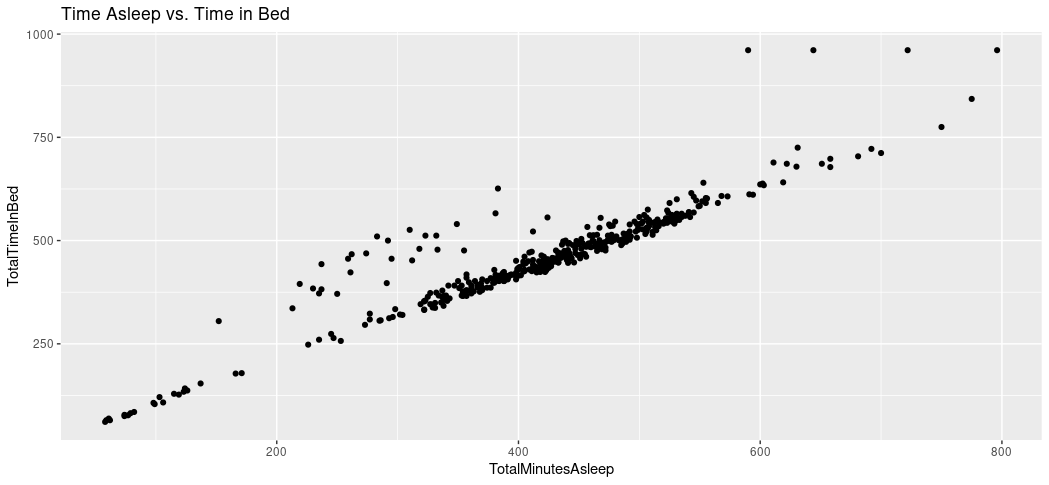
This plot shows the relationship between time spent asleep vs. the time in bed. In my analysis, there is an average of 420 minutes, or 7 hours, spent sleeping. However, the people in the survey also spend, on average, 39 more minutes in bed, awake. This tells us a few things: 1) While most people are getting enough sleep, there is a large percentage who are getting fewer than the recommended 7-9 hours of rest.
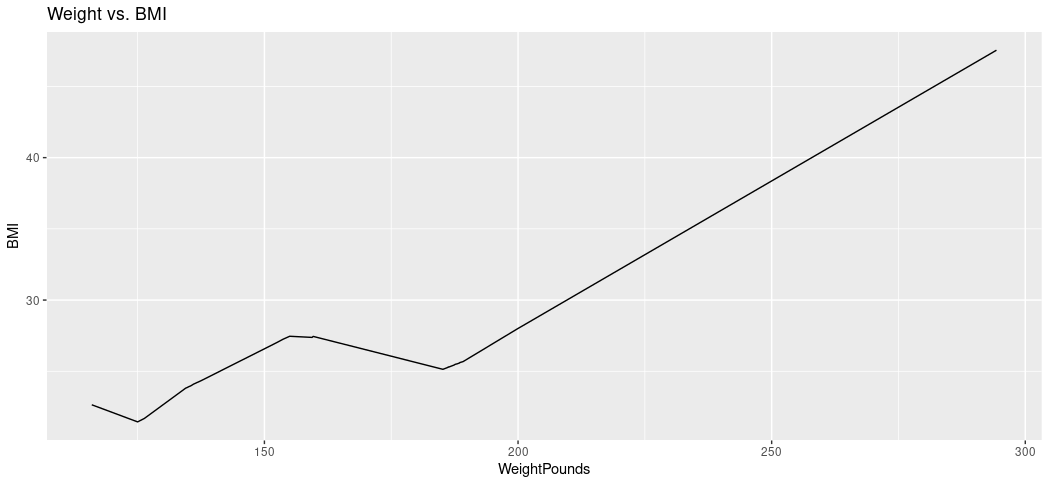
This chart confirms my deduction of higher weight leading to higher BMI. However, during my analysis it was shown that there were very few people who chose to disclose their weight (only 8 unique IDs) so the possibility of bias is significant.
Analysis/Conclusions
It’s likely that people who purchase Bellabeat products are mindful of their health. Using the information from our analysis, we can conclude a few things:
The relationship between being active and calories burned is evident. Bellabeat can utilize this information in a few ways. First, market the app and tracker in a way that promotes a healthy, active lifestyle. This can be done via social media, where it can be presumed that there are more people who would be exposed to this situation. Second, anecdotal evidence shows that there is a negative relationship between stress, weight gain, and a reduction in sleep quality. While there is no data to support this, marketing Bellabeat’s app and membership options in a way that increases mindfulness activities can be something that should be looked into.